Check Inman every day for the daily version of this market roundup.
Mortgage rates:
Home equity rates:
Friday, July 29
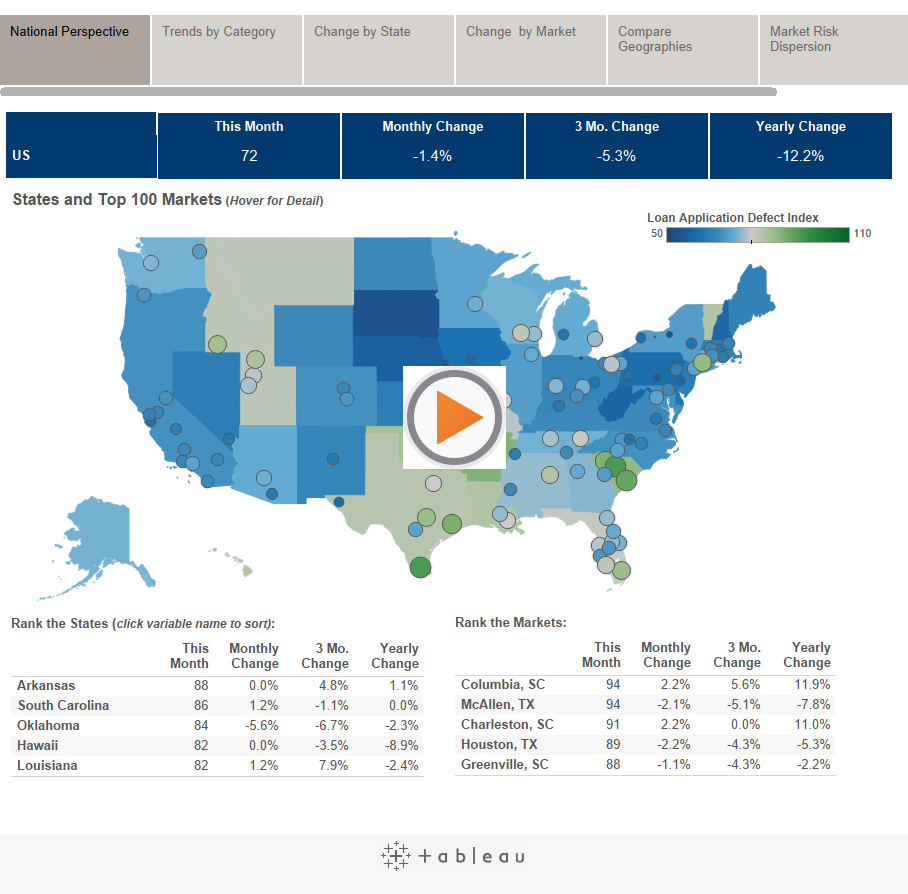
First American June 2016 Loan Application Defect Index:
- The index decreased 1.4 percent in June from May.
- Year-over-year, the index decreased 12.2 percent.
- At the high point of risk in October 2013, the index measured 29.4 percent.
Wednesday, July 27
Mortgage Bankers Association’s weekly applications survey:
- Mortgage applications decreased 11.2 percent from one week earlier.
- The Refinance Index decreased 15 percent week-over-week.
- The seasonally adjusted Purchase Index decreased 3 percent week-over-week to its lowest level since February 2016.
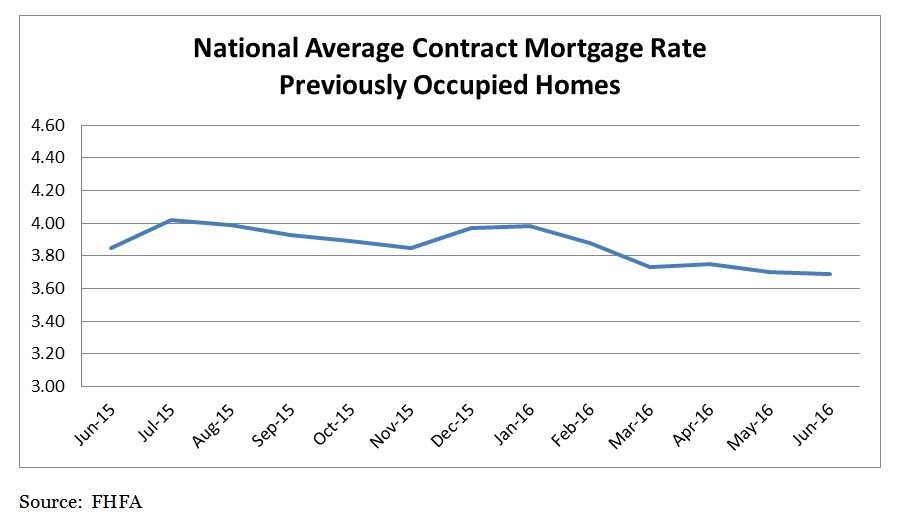
Federal Housing Finance Agency’s mortgage rate indices for June 2016:
- Interest rates on conventional mortgages were little changed from May 2016 to June 2016.
- The average interest rate on all mortgage loans was 3.70 percent.
- The average loan amount was $333,900 in June, up $4,400 from May.
Freddie Mac’s Multi-Indicator Market Index (MiMi):
- The national MiMi value stands at 85.
- This is up 1.05 percent month-over-month and 2.39 percent quarter-over-quarter.
- Year-over-year, the MiMi is up 7.30 percent.
Tuesday, July 26:
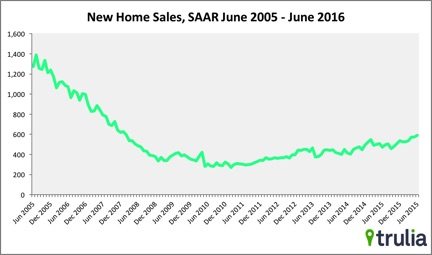
U.S. Census and Department of Housing and Urban Development’s New Residential Sales for June 2016:
- Sales of new single-family homes were at a seasonally adjusted annual rate of 592,000.
- That’s 3.5 percent higher than the May 2016 estimate (572,000) and 25.4 percent above the June 2015 estimate of 472,000.
- The median sales price of new homes sold in June 2016 was $306,700.
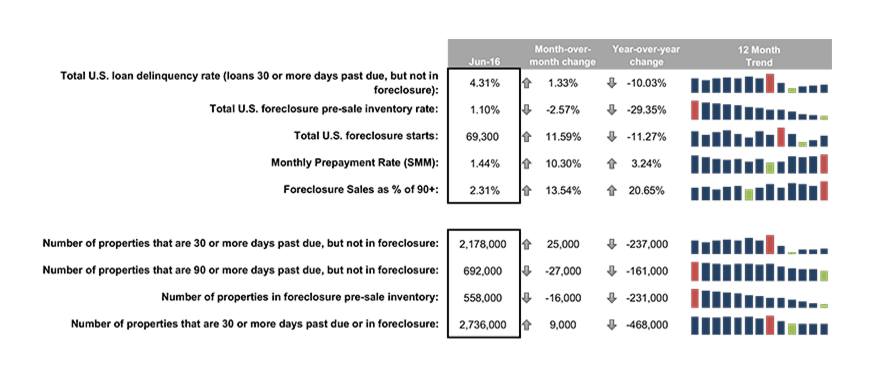
Black Knight Financial Services’ “First Look” at June 2016 mortgage data:
- June’s first-time foreclosure starts (those properties starting the foreclosure process for the first time) were at 69,300 — the lowest starts reported in 16 years.
- Total U.S. foreclosure sales are at 2.31 percent — a 13.54 percent month-over-month and a 20.65 percent year-over-year increase.
- The U.S. loan delinquency rate, which includes homes that are 30 or more days past due, but not in foreclosure, experienced a 1.33 percent month-over-month increase and a 10.03 percent year-over-year decrease from June 2015.
 S&P/Case-Shiller Home Price Index for May 2016:
- May 2016 marks 49 consecutive months of positive home price gains.
- In May, the national home price index reported a 5 percent annual gain — growth that’s level with the yearly index gain recorded in April.
- Portland (12.5 percent) reported the highest year-over-year gains, followed by Seattle (10.7 percent) and Denver (9.5 percent).
Monday, July 25:
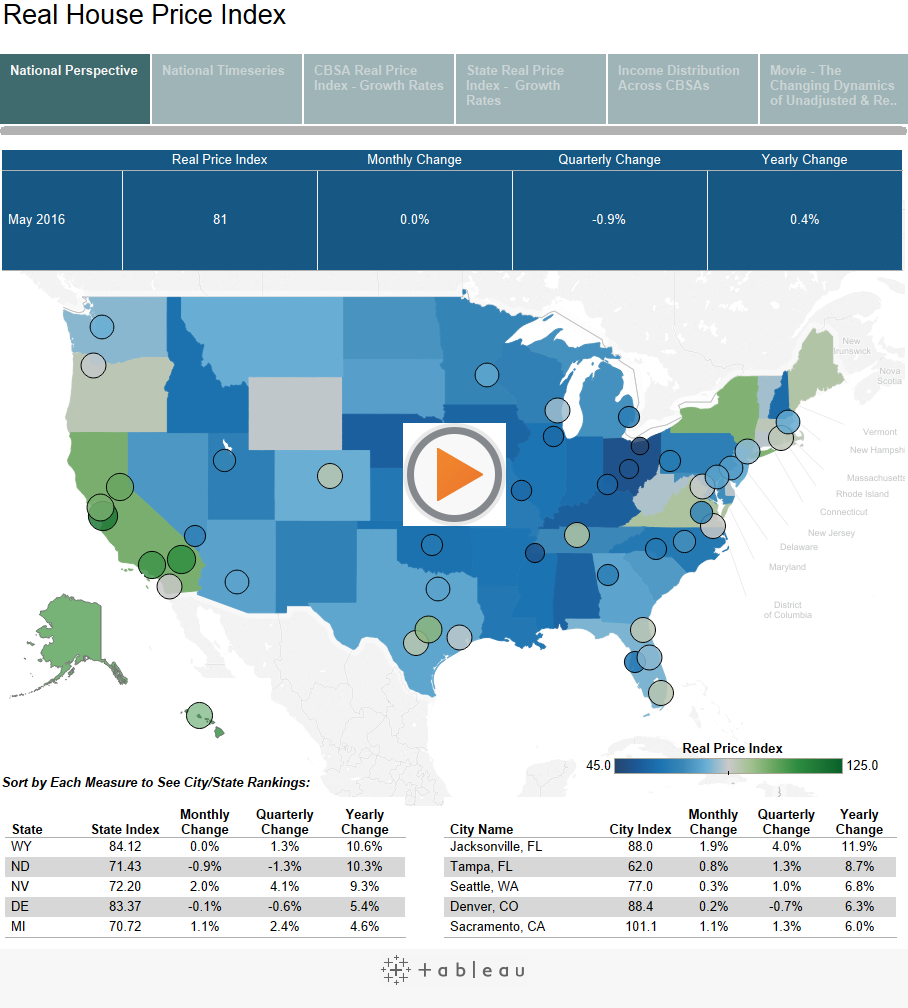
First American’s Real House Price Index (RHPI) for May 2016:
- Real house prices are 19 percent lower than they were in 2000.
- The RHPI was unchanged in May 2016 from April 2016.
- The RHPI increased 0.4 percent from May 2015 to May 2016.
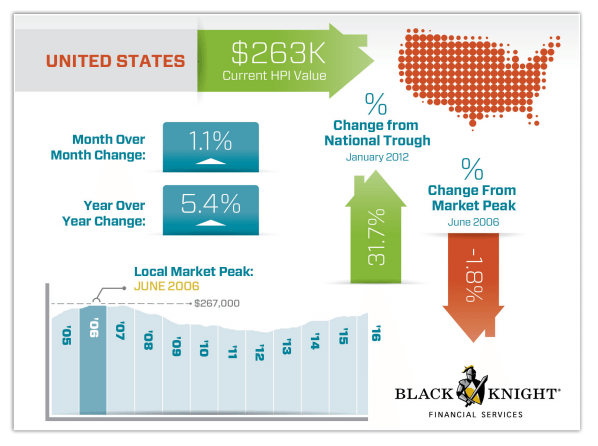
Black Knight Financial Services’ May 2016 Home Price Index:
- The home price index in May was $263,000, up 31.7 percent from market bottom and 1.8 percent below the June 2006 peak.
- Mountain states accounted for eight of 10 top-performing metro areas.
- All states and metros experienced positive price movement in May, and six large states and 15 large metros hit new price peaks.
Email market news to press@inman.com.